Step 5- Stratigraphic model
In this step of the tutorial we will see how to obtain a stratigraphic model that closely approximates the behaviour described by the H/V spectral ratio obtained.
You can load the file "Step_4" inside the tutorial folder, which contains the data needed to proceed from this point of the tutorial onwards.
- First of all click on the tab named "H/V Spectrum" as shown in the figure

- Within the "Model" section choose the "Automatic search" option and, using the add button with the following icon

, add three layers (press the button three times)
-
In the column named "Thickness" of the first row of the table, enter the value "2", while in the column named "Vs" of the same row enter the value 120.
-
In the same row, tick the boxes in the columns named "Lock thickness" and "Lock velocity", since in HVSR analyses, in order to obtain a good result, the actual data of at least the first layer must be known.
-
Then change the value in the column named "Maximum thickness" of the second row, setting it to 20, and in the column named "Vs Max" of the same row set 500
-
In the column named "Vs Max" of the third row set the value 900, and in the column named "Vs min" set 400. With all the data just entered we have simply narrowed the search ranges of the automatic search.

-
Clicking now on the "Search" button, a further curve appears on the H/V spectral ratio chart, representing the ellipticity of the stratigraphic model contained in the table. PLEASE NOTE: what has just been obtained does not represent the exact stratigraphic model that can generate the H/V curve, but only an estimate of it. By changing the parameters within the table it is possible to "tune" the stratigraphic model better to that curve. The automatic search is only an aid for the user, so as not to have to start looking for a reliable model from scratch. The automatic search provides a simple estimate. It is the user's task to refine the estimate obtained in this way, so that the ellipticity curve properly interprets the behaviour of the H/V spectral ratio according to the criteria and observations the user considers appropriate.
-
By changing any of the values present in the table that does not concern a limit of the search range, and pressing the button named "Synthesise", it is possible to check the result in terms of ellipticity on the H/V spectral ratio chart
-
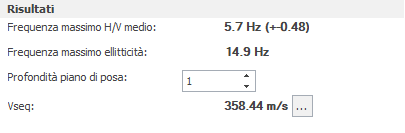
In the results section you can read the value of the frequency at which the peak of the ellipticity is located, and the Vs30 associated with the stratigraphy present in the main model table.
Some observations
The automatic search is only an aid for the user. Nothing prevents you from proceeding with a manual search, entering the number of layers with the characteristics you consider most appropriate.
The misfit value is not to be understood in an absolute sense, but only in a relative one: it is useful only when comparing two models, and is not indicative of a close match between the ellipticity curve and that of the H/V spectral ratio. In an ideal situation (not achievable in practice), a misfit value equal to zero would mean a perfect coincidence between the two curves. Such an asymptotic situation would in any case not be indicative of a solution of the HVSR inversion problem. The misfit value is therefore only a parameter useful when comparing the various models whose ellipticity curve has been evaluated.
The automatic search can be performed several times, since the stratigraphy data at the beginning of the search are a starting point around which possibly better solutions than those previously found are sought.
Each computed model can be stored and managed by ticking "Show multiple models" and using the "Store" and "Remove" buttons. Once a model has been stored, it is reported in the model table in the order in which it was added, showing not only its name but also its misfit value. The model can be recalled simply by selecting the corresponding row within the model table.
©Geostru