Initial data
Objective of this step: to identify the survey. It does not affect the calculation, but everything you enter here is automatically carried over into the final report, so it is worth filling it in straight away and properly.
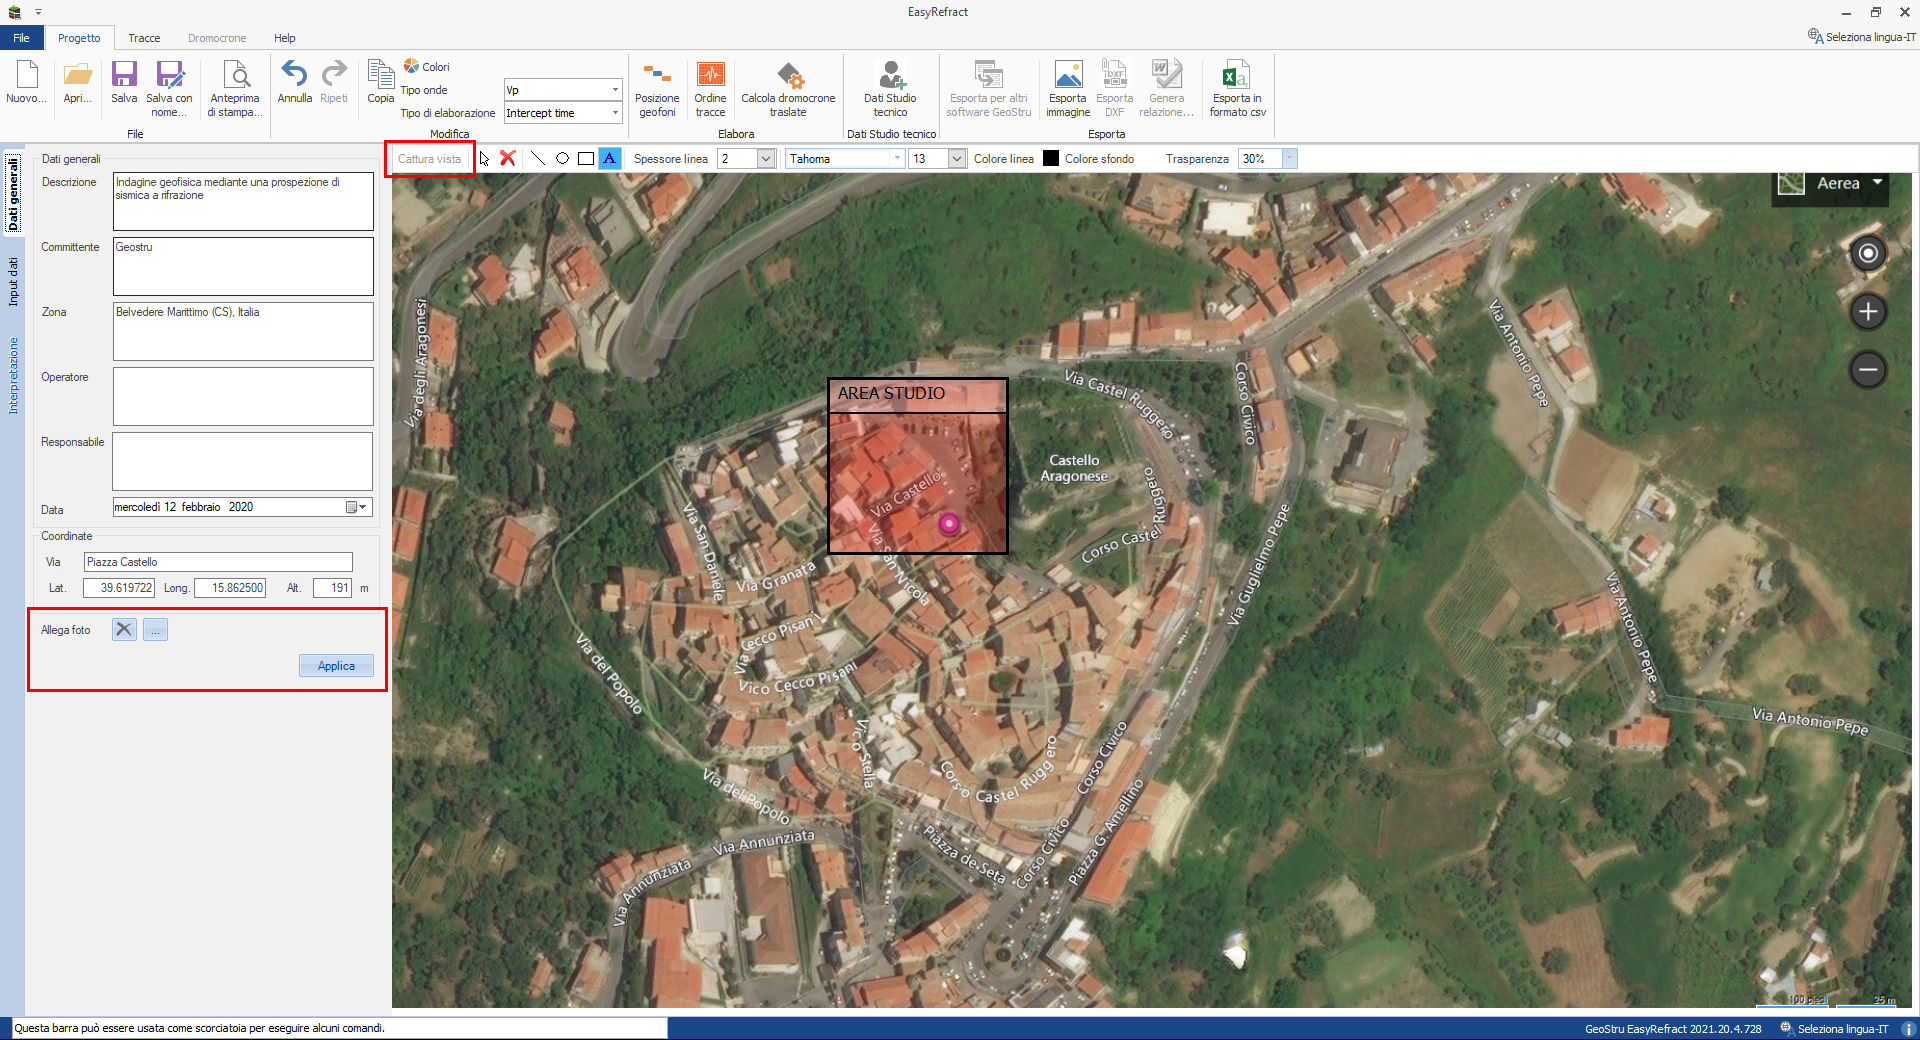
Start Easy Refract from the shortcut in the Windows Start menu and open the Project → General data section (the commands are highlighted by the red boxes). Fill in description, customer, area, operator, responsible and date.

Framing the area on the map
The survey area can be displayed on Google Maps by entering the coordinates: an Internet connection is required. If you have sexagesimal coordinates, convert them into decimal degrees first.

With Capture view the map image is frozen: you can then overlay boxes, circles, lines and text boxes to indicate the study area or to draw the seismic spread. You can change the font, size and colour of the text, and delete the inserted elements with the X button.
Legible text in the report
The image is reproduced in the report at reduced size: write the labels with a large enough font, otherwise they will be illegible in the report.
With Attach photo you can insert a logo or a photograph of the site: it will appear on the title page of the report.
When you have finished, press Apply to save the data.
The next step is to load the seismograms recorded in the field: How to import the data.